
For over 100 years, operators have been using water to produce oil and gas from conventional reservoirs, mostly by water flooding to enhance production after the initial reservoir pressure declines. Produced water, along with additional surface water or groundwater, is often injected into the formation to increase the reservoir pressure and maintain production levels. Water is a much bigger issue for oil and gas production from unconventional reservoirs than conventional reservoirs. Let’s take a look at the historical perspective that brought unconventional production and water use front and center during the first decade of the Shale Boom (2005-2015).
The Shale Boom Changed the Energy Landscape
Back in 1970, U.S. oil production seemed to have peaked at 9.6 million barrels per day (BPD), and by 2005 had been declining for 35 years. Oil production in 2005 stood at only 5.2 million BPD in the United States, and crude oil imports were 10.1 million BPD (slightly less than 50% of total U.S. petroleum consumption). The U.S. economy was in a precarious situation, highly dependent on oil imports from countries whose interests weren’t always aligned with the United States, like Venezuela and Saudi Arabia.1Rapier, Robert, 2017, “How The Shale Boom Turned The World Upside Down,” Forbes,https://www.forbes.com/sites/rrapier/2017/04/21/how-the-shale-boom-turned-the-world-upside-down (accessed December 21, 2022).
The country’s situation regarding natural gas was quite similar. U.S. gas production had peaked in 1973 at 21.7 trillion cubic feet (Tcf). U.S. production had dropped to 16 Tcf by 1986. Production recovered slightly by 2005 to 18.1 Tcf. The future for natural gas looked to be in such short supply that companies began to plan and build liquefied natural gas (LNG) import facilities to mitigate the expected shortfall.2U.S. Energy Information Administration (EIA), 2022, “The United States now produces nearly all the natural gas that it uses,” https://www.eia.gov/energyexplained/natural-gas/where-our-natural-gas-comes-from.php (accessed December 21, 2022)
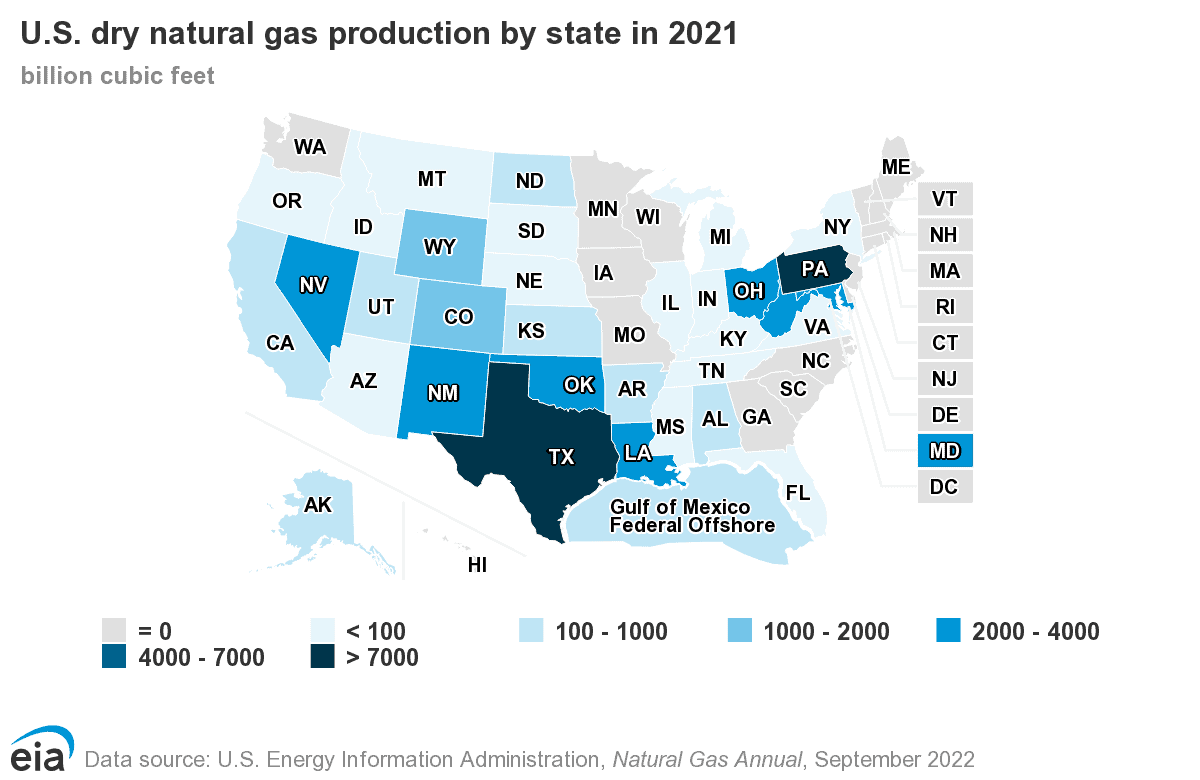
Then in 2005, George Mitchell refined a technique combining hydraulic fracturing with horizontal drilling—two standard techniques used in the oil and gas industry for decades—to target unconventional reservoirs. These reservoirs were low permeability rocks known as shale. His innovative idea proved very successful. U.S. natural gas production rose for 10 straight years between 2005 and 2015 to reach 27 Tcf. And the United States became the world’s largest natural gas producer.3 U.S. gas production in 2021 was 34.5 Tcf, with 3.9 Tcf of exports.4 In the map from the U.S. Energy Information Administration, you can see the major states that contribute to the United States ability to produce all of the natural gas that we consume and then some.
U.S. oil production started its increase in 2008, with production of U.S. crude oil and natural gas liquids increasing by six million BPD over the next sever years. Between 2005 and 2015, net imports of crude oil and products to the United States dropped from 12.5 to 4.7 million BPD. The country began exporting finished products and crude oil.5 In 2021, U.S. oil production reached 16.6 million BPD. The highest point in history was pre-pandemic in 2019 at 17.1 million BPD.6
Water Use for Shale Development
Water is a much bigger issue for oil and gas production from unconventional reservoirs than conventional reservoirs because of the large upfront water requirements for hydraulic fracturing. Also large volumes of flowback and produced water from the well cannot be reinjected into the producing reservoir because of low permeability.
For shale development, drilling each well requires between 50,000 and 100,000 gallons of water. Operators require an additional 3 million to 10 million gallons of water for the hydraulic fracturing process. However, water withdrawals for exploiting unconventional shale resources typically fall between 0.1% and 1% of all withdrawals in a state or region. Typically, producers of eastern shale plays, such as the Marcellus, rely on surface water. Producers of western shale plays, such as the Eagle Ford, use much more groundwater due to the climate in the area.
During hydraulic fracturing, fluids are injected into subsurface shale at high pressure for several hours per stage. There may be between 3 and 6 stages per 1,000 feet of horizontal well. The entire process may take days or weeks depending on the complexity of the operation. Between 5% and 50% of initially injected fluids return to the surface as flowback. Then between 5 and 10 barrels of produced water return for every million cubic feet of natural gas or for every barrel of oil.
One of our experts lends his perspective on the emotional, political and technical aspects of unconventional oil and gas development.
Transcript
Environmental Solutions in the Oil & Gas Industry – Mike Parker – Parker Environmental Consulting
The idea of having emotion, political implications and technology in an issue are common to a lot of issues. I would say that with respect to nonconventional oil and gas development, they’re probably a little bit higher and I say that very conservatively. There’s a lot of emotion in certain parts of the country with respect to development of oil and gas resources. There are solutions. They have to be worked out through legal and regulatory means, a political process. At the end of the day, those solutions that get acted out or get implemented are technical solutions. We’ve been very successful in solving a lot of these problems. I mean, just the simple fact that we’re developing these resources today illustrates the technology we’re able to bring to this. Along with that has to be the political will to let that development occur and then of course the emotional acceptance of that development as well. It all kind of ties together in my mind, that’s why I like that quote.
Citations
Map: U.S. Energy Information Administration (EIA), https://www.eia.gov/energyexplained/natural-gas/where-our-natural-gas-comes-from.php.
Images: “Fracking Operations” by Joshua Doubek licensed under CC BY SA 3.0