After acquiring existing data and information from as many sources as possible, it’s time to analyze and compile them into a reasonably accurate representation of the subsurface.
Many techniques exist for obtaining information about what’s below the surface of the Earth. However, most of these techniques require a significant investment of time and resources. Before oil companies invest in these techniques, they use the data and information they have acquired to construct simple models of what’s going on underground, which can be used to direct more expensive resources to where they are needed most.
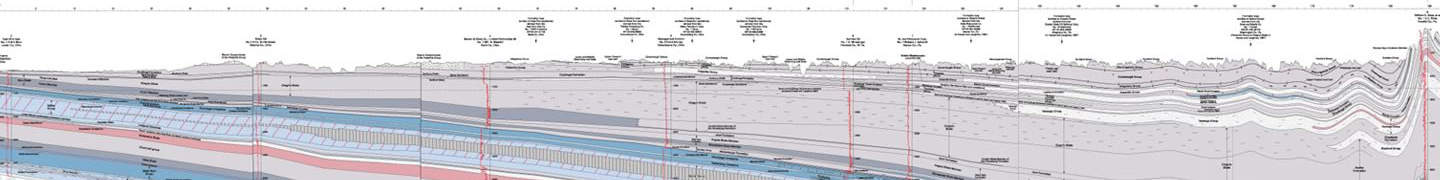
One of the most common tools used to develop an understanding of subsurface structures is the geologic cross section.
Geologic Cross Sections
A cross section represents a vertical slice of the Earth. Imagine cutting open a cake so you can see its internal layers.
On a geologic map, the layers sliced by a cross section are usually marked by bold lines cutting across the map. Each line is labelled at each end with the same letter. For example, one end of the line might have the label A, and the other end A’. These symbols match up with symbols at each end of the cross section diagram.
An initial cross section can be developed by extrapolating the orientations of beds at the surface to locations at depth. Assuming that layers are continuous and of predictable thickness, they can be connected underground to create a basic cross section.
Here is a step by step example of how to go about making a cross section:
1. Cross Section Path
First, the path of the cross section is drawn on the map. Geologists decide what area of the map they are interested in. For example, if a geologist suspects that a structural trap may exist beneath an anticline fold, he may choose to draw a cross section that intersects many suspected folds.
In our case, we’ll take a look at the process of making a cross section from a simple geologic map.

In this image, the cross section extends from point A to point A’. It crosses several units, each specified by a different color. For this example, we’ve only included the direction in which the units are dipping. In reality, geologists would record the exact angle of dip for each strike and dip location.
Remember, the little line on the strike and dip symbol points downhill on the bed. The cross symbols on the green unit indicate that the beds are horizontal.
Given this top down view, the path of the cross section, and some strike and dip information, we’re now ready to begin the next step.
Since a cross section represents a vertical slice of the Earth’s crust, we need to draw it from a side view. The Earth’s surface isn’t flat, so the first thing we need to do is draw the land surface. Normally, this can be determined from a topographic map or digital elevation data. In this case, we’ve drawn it in for you.
2. Transfer Unit Contacts
The next step is to transfer the unit contacts from the map to the cross section. A unit contact occurs whenever one rock unit transitions to another. Each unit has two contacts, one above and one below. By transferring the contacts, we can see how each bed intersects the land surface.

As seen in the example above, topographic data from the line of cross section on the geologic map is transposed to the cross section. Next, the displacement along the line where each contact occurs is transposed to the cross section. Finally, the angles of the contacts, recorded by the strike and dip symbols, are drawn on the surface to serve as a guide for interpretation.
3. Draw Contact Angles
Since we know the orientations of the beds from the strike and dip data, we can draw each contact at the angle at which it intersects the surface.
Once we’ve transferred the contacts, the real work begins. We need to figure out a way that we can logically reconnect the beds. There are a few simple rules:
- The surface intercept data is fixed.
- Units should have consistent thicknesses.
- Units should be continuous, unless they are interrupted by faulting or erosion.
One possible interpretation is shown below.

Based in the surface data alone, this cross section seems to do a good job explaining what is happening underground. The units are of constant thickness and are continuous (except where they have been eroded at the surface). However, cross sections drawn based only on surface geology have several weaknesses:
- They can only show structures that reach the Earth’s surface.
- They cannot account for changes in bed thickness over the extent of a bed.
- They are unable to resolve small scale structures that could serve as oil and gas traps.
Images: “Geologic Cross Section” by USGS; “Illustrations” by Top Energy Training