Before setting foot in the oil field, a geologist needs to do some research.
A wealth of geologic information is available for most regions on Earth. This information includes existing geologic maps, aerial and satellite photographs, and topographic maps. In order to use this information to maximize the efficiency of future field work, an exploration geologist compiles the data into one map. This map is referred to as a base map.
Base Maps
Traditionally, base maps were printed and carried into the field to be marked up by hand. These days, many field geologists use a portable computer or tablet to view the base map and add new information. The GPS capabilities of these computers allow geologists to pinpoint their exact location. In addition, different types of data can be layered on the map, allowing geologists to view only the relevant information.
Let’s look at some of the typical components of a base map.
Topographic Contour Maps
Topographic contour maps describe the shape of the land surface using contour lines. A contour line is a line connecting points of equal elevation. These maps are used by many people, for example, hikers, to plan journeys or excursions across a variety of terrains. In oil and gas operations topographic maps have a number of applications ranging from initial exploration, to siting the wellsite, to projecting runoff of any potential spills and environmental impact.
Imagine a lake. The shore of the lake represents a set of points with a given elevation.
Now imagine that every morning, the level of water in the lake falls by one foot. The rings left around the shore by the receding water would each describe a separate set of points with equal elevations. Each ring is a contour line.
A contour map has many contours, spaced at a consistent vertical interval, called the contour interval. In our lake example, the amount the water fell each morning, one foot, was the contour interval.
In reality, contour intervals are typically much greater than one foot. For example, a map with a contour interval of 20 feet would have contour lines representing elevations of 20 feet, 40 feet, 60 feet, and so on.
The spacing of contour lines tells us about the slope of the land surface. When lines are far apart, you need to walk a long way to increase your elevation, meaning that the slope is gentle. In contrast, if the lines are close together, a large vertical change occurs over a short horizontal distance and the slope is steeper.
Ridges, valleys, plains, and most other topographic features can be described by contour lines.
Let’s look at a couple of examples.

In this USGS topographic map, the contour interval is 20 meters.
Based on what we talked about above, you should be able to look at the contour lines and identify major landforms. The landforms labeled as mountains are steep sided – we know this because the contour lines are close together. In contrast, the flat, swampy area in the middle of the map has widely spaced contours.
By looking at the bold contour lines, which are labeled with the elevation they represent, we can tell that the valley in the middle is lower than the surrounding peaks. Even without the contour labels, it makes sense that the valley is lower – several streams run down the slopes of the mountains, converge in the valley and flow out the south end.
If we want to find the elevation along a specific line, we just count how many lines separate it from one of the labeled lines, multiply that number by the contour interval, and add or subtract it from the elevation of the labeled line depending on whether the line in question is uphill or downhill from the index line.

In rare cases, closed depressions can occur in topographic maps. These usually represent unusual features such as sinkholes, volcanic craters, and desert basins. Closed depressions, like Military Sinkhole in this map segment, are marked with hatch marks.
Topographic contour maps are the most common type of contour map and are always used in field mapping. However, contours can be used to describe any surface. Later, we’ll talk about contours that describe the shape of underground rock layers.
Air Photos and Satellite Imagery
A field geologist can usually determine his or her location by matching features on the topographic map with the features he can see, or, for greater accuracy, using a GPS receiver.
Often, however, a geologist wants more information than can be found on a topographic map:
- Is the land surface open or forested?
- Are there exposures of bedrock?
- How easy will it be to access a site for fieldwork or drilling?
- How has a particular site changed through time?
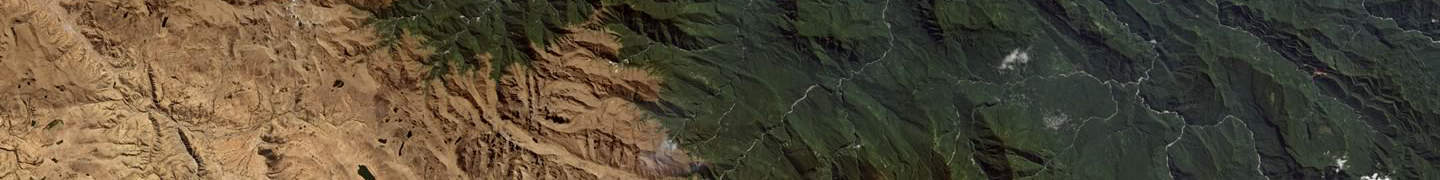
One economical way to answer these questions is through the use of imagery captured by airplanes and satellites. These remotely captured images contain a wealth of information.
Air photos and satellite imagery are used for all phases of oil and gas development, including the development of geologic maps, planning of drill sites, environmental monitoring, and restoration of closed well sites.
There are several sources for air photos and satellite imagery. The most familiar to readers is probably Google Maps or an equivalent online mapping platform. Despite the satellite label, the imagery available on Google Maps is actually a blend of air photos and satellite images.
In order to obtain photographs that show current surface conditions, companies can pay for air photo services. In addition, a wealth of imagery is available through government agencies and for-profit companies.

Existing Geologic Maps
Most of the earth has been mapped by geologists. However, many regions have been mapped remotely and existing maps may not have enough detail to provide all the information an exploration geologist needs to find oil. Despite this, an existing geologic map is useful because it allows geologists to familiarize themselves with local rock units and understand the basics of the local geology. We’ll talk about how geologic maps are made and used in the next section.
Images: “Bolivian Andes” by NASA