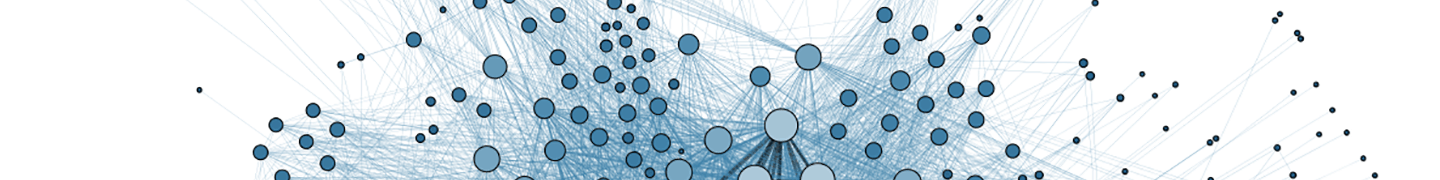
Social networking extends far beyond your Facebook profile, Twitter feed, LinkedIn groups and email address books. Every organization made of people, from a small village to a large corporation, produces a social network, which is a natural phenomenon of all the connections between those people in the group. In order to understand a difficult situation or a group of diverse individuals who are all working together, you can model and analyze a social network. Models can be very complex, like a model of the Internet, or very simple, like a model of people who live on your street. Each starts with a series of points representing the people and the lines that represent their connections. This forms a sociogram.

Let’s look at the example of a short street in a small town. Even those people who spend lots of time traveling or secluded in their homes have some interaction and relationship with the other people. However, not everyone knows everyone else. Some individuals are very social and have many connections with their neighbors. Some only have one or two connections. In the example image here, the fifth neighbor has a connection with five other neighbors, and the second neighbor only has a connection with the third neighbor. However, through the network, the second neighbor is connected with the others. Expanding this analysis, one can identify isolates (neighbor 2), asymmetries (more connected right side), reciprocity and indirect connections. Some networks also have a central figure, who has a connection with everyone else in the network.
For a different example, imagine the sociogram of stakeholders on an oil and gas production site. The landowner, the well site supervisor, and the oil and gas field inspector are all points with connections between them. However, the supervisor has a boss, who reports to a vice president or corporate executive who rarely has a connection with the landowner. Likewise, the field inspector has a manager, who has an agency director, who may report directly to the governor or a legislator. The landowner similarly has connections to other landowners, other operators, representatives of environmental and citizens’ groups, and her own family and friends. The magic of human networks is that there may be surprising or asymmetrical connections between these points. For example, the oil executive may be connected to the legislators or governor, or the friends of the landowner may be connected to members of the regulatory agency. Organizing and analyzing networks is one way to better understand complex relationships between people.
All social networks have value. The network concept was originally postulated in regards to networks of technologies, but anthropologists and sociologists have since expanded the purview to include networks of people. Metcalfe’s Law states that the value of the network is proportional to the square of the number of connected users, or nodes (n) in the network. And the number of unique connections in a network can be expressed mathematically as n(n − 1)/2.
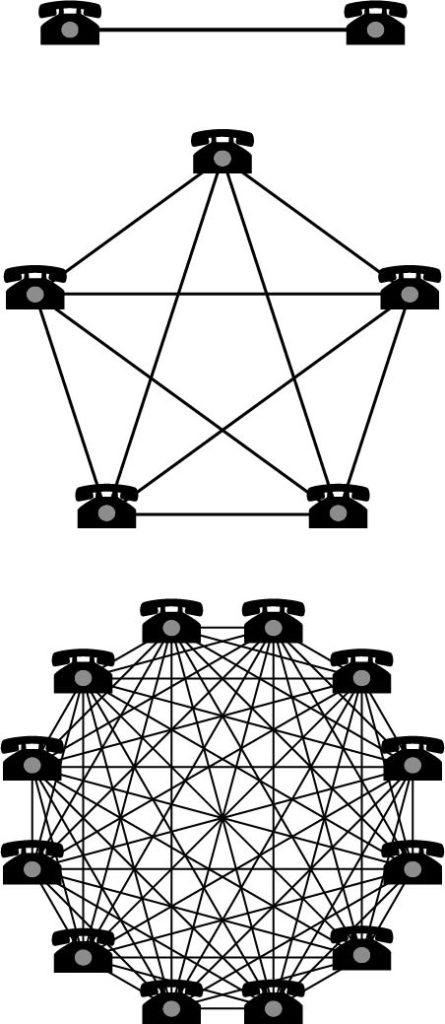
For example, Alexander Graham Bell’s telephone was connected to only one other telephone. Similar to the network at the top of the figure shown here, Bell had only two nodes on this early phone network and the total number of connections was 1. This figure illustrates how an increasing number of nodes results in an expanding network. Five nodes (n=5) can make 10 connections [n(n-1)/2], and twelve nodes results in 66 connections.
In 2014, active mobile phones outnumbered humans for the first time ever. At the time there were over 7.22 billion mobile devices on Earth.1Boren, Z. D. (2014, October 8). Active mobile phones outnumber humans for the first time. International Business Journal. Retrieved from https://www.ibtimes.co.uk These devices could make more than 22 quintillion (that’s 18 zeros!) connections, with the value of the network proportional to 7.22 billion squared. Model calculations such as these help conceptualize the magnitude of the value of a larger network.
Images: “Social Network Analysis Visualization” by Martin Grandjean licensed under CC BY SA 3.0