
The most obvious way to reduce CO2 emissions is to reduce the consumption of CO2-producing energy sources. Unfortunately, this is a difficult task that not all economies are equipped or willing to undertake. Looking at the charts below, we can see a relationship for some countries between current coal consumption and CO2 emissions. We can also see trends in coal consumption and CO2 emissions in various countries over several decades.
Primer on Measuring CO2
a metric tonne = 1 t = 1,000 kg
1 Mt = 106 t = 1 megatonne
1 Gt = 109 t = 1 gigatonne
The spelling ‘tonne’ distinguishes the metric tonne from the Imperial measurement (still used in the United States) of ton. The imperial ton = 2000lbs (approx. 907 kg).
1 metric tonne is about 93 kg heavier than 1 U.S. ton. In this lesson, we use metric tonne when discussing the mass of CO2.
As the graphs show, countries/regions that heavily industrialized in the 20th century (United States, Russia, Japan, Europe) have reduced their emissions moderately over the past 10 years, but not by nearly enough to offset the rise in emissions from newly industrializing economies in China, India, and Indonesia.
CO2 Emissions & Industrialization
China, India, United States, and Indonesia are the four most populous countries in the world, as of July 2020. Compare their populations with their emissions in the table below:
| Population1U.S. Census Bureau. (2023, January 1). U.S. Census Bureau Current Population. Retrieved 1/1/2023 from https://www.census.gov/popclock/print.php?component=counter | Total CO2 Emissions (million tonnes) | CO2 Emissions per capita (tonnes / person) | Projected Total CO2 Emissions Using U.S. per capita rate (million tonnes) | |
|---|---|---|---|---|
| China | 1,410,539,758 | 9,826 | 7.0 | 20,980 |
| India | 1,389,637,446 | 2,480 | 1.9 | 19,958 |
| United States | 332,838,183 | 4,965 | 15.1 | 4,965 |
| Indonesia | 277,329,163 | 632 | 2.4 | 4,019 |
You can see that the non-U.S. countries are significantly behind the United States in terms of per capita CO2 emissions, and as industrialization in these countries continues at a rapid pace, there is little reason to assume they will not trend towards U.S.-levels of per capita emissions. With no other mitigating factors, if those three countries reach U.S.-levels of emissions, global emissions would double. Although reducing overall consumption and production is the significant factor in curtailing global warming, we have a very long way to go to reach sustainable levels. In the interim, we must develop additional methods to curtail CO2 emissions in the atmosphere.
CO2 Emissions & the Energy Connection in the United States
Fossil fuels consist primarily of carbon and hydrogen. When these fuels are burned, chemical reactions release heat, which we then use for energy. Oxygen combines with carbon to form CO2. And, oxygen combines with hydrogen to form water. The amount of CO2 emitted depends on the carbon content of the fuel. The amount of heat produced depends on both the carbon and hydrogen content. Because natural gas (mostly CH4) has a high hydrogen content, burning of natural gas produces less CO2 for the same amount of heat produced than burning other fossil fuels. For example, for the same amount of energy produced, burning natural gas produces about half of the amount of CO2 produced by burning coal. For this reason, switching from coal to natural gas results in CO2 emissions reduction.2U.S. Energy Information Administration. (2022, June 24). Energy and the environment
explained: Where greenhouse gases come from. Retrieved 1/8/2023 from
https://www.eia.gov/energyexplained/energy-and-the-environment/where-greenhouse-gases-
come-from.php.
In 2021, petroleum accounted for about 36% of U.S. energy consumption but petroleum was the source of 46% of total annual U.S. energy-related CO2 emissions. Natural gas provided about 32% U.S. energy but accounted for a much lower level of total annual energy-related CO2 emissions (34%). Coal was the source of only about 12% of U.S. energy use, but contributed 21% of total annual energy-related CO2 emissions. The emissions from each of these energy sources is highlighted in the chart below.3U.S. Energy Information Administration. (2022, June 24). Energy and the environment explained: Where greenhouse gases come from. Retrieved 1/8/2023 from https://www.eia.gov/energyexplained/energy-and-the-environment/where-greenhouse-gases-come-from.php.
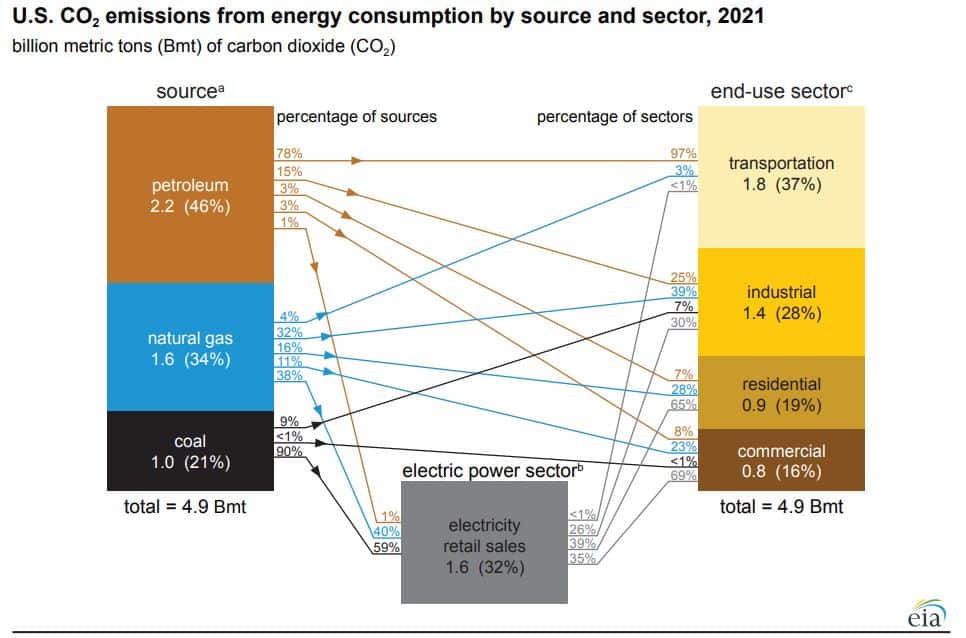
At the right and lower center of the chart, you can see that CO2 emissions stem from the major energy consuming sectors: transportation, industrial, residential, commercial, and electric power. The transportation sector accounted for the largest share of U.S. energy end-use CO2 emissions in 2021, in part because of its near complete dependence on petroleum fuels.4U.S. Energy Information Administration. (2022, June 24). Energy and the environment explained: Where greenhouse gases come from. Retrieved 1/8/2023 from https://www.eia.gov/energyexplained/energy-and-the-environment/where-greenhouse-gases-come-from.php.
Citations
1. Bradley, Tim. (n.d.). The CO2 enhanced oil recovery story. Retrieved 1/1/2023 from https://www.edf.org/sites/default/files/10254_Bradley.pdf
Images: “Rail Cars Loaded with Coal” by Mikhail Sedov via Shutterstock