Since well logging tools don’t directly measure rock attributes, we need to find a way to correlate the measurements we’ve made to the real attributes of each rock unit. The only real way to do this is to compare the logging results from a certain interval with the measured attributes of a core sample from the same interval, which then helps to calibrate what the actual physical measurements from the rock (core) are compared to the logging responses.
Using a statistical method called core-log correlation, we can use well logs calibrated to a cored interval to predict real rock attributes throughout the well.
Let’s look at core-log correlation in a bit more detail.
Transcript
Core-log Correlations – Azra N. Tutuncu – Colorado School of Mines
During the formation evaluation process drillers are trying to answer one question: can a well produce oil or gas economically?
This question is answered based on the reservoir engineer’s understanding of rock units making up potential petroleum systems. The key rock attributes include porosity, hydrocarbon saturation, permeability and strength.
The most accurate way to measure these attributes is to physically remove a core sample from the well, bring it to the laboratory, and run a series of detailed, accurate tests in a controlled environment. In a perfect world, we’d be able to core the entire well.
Unfortunately, the costs and technical difficulties of coring make this task impossible. During the coring, all drilling operations must stop, resulting in costly non-productive downtime.
Because of this expense, instead of coring the entire well, drillers are forced to rely on indirect methods of studying the formation the well passes through on its way to total depth, also known as TD.
Wireline tools are lowered into the hole during tripping operations, and logging while drilling tools allow us to measure the formation characteristics without ever stopping the drilling.
Clearly these measurements are not as accurate as the ones we would get by studying core samples, but they are much more economical.
Fortunately, there is a middle ground between the efficiency and low cost of well logging and the accuracy of core drilling. That middle ground is the technique known as core-log correlation.
Here’s how it works:
During the development of an oil or gas field, geologists select intervals of the stratigraphy that they think are representative of the units in the region. These intervals are cored during the drilling of the wells. The process is expensive, yet, it gives geoscientists and engineers the opportunity to collect high resolution laboratory data about these units.
Next, standard well-logging techniques are used to collect data from the sections of cored wells.
Finally, geoscientists use complex statistical models to develop a correlation between the indirect measurements from the well logs and the direct core measurements conducted under realistic in situ conditions in the laboratory. This allows them to calibrate the well-logging data for the units of interest.
Once they develop a statistical relationship between the well log measurements and the highly accurate core measurements in the laboratory, they are able to predict the true attributes of rock units based on the indirect measurements from the well logs.
When well logs are used for rock characteristics, larger volumes of formations are measured than the core sample volumes measured in the laboratory. This scale difference in the measurements needs to be included in the analysis for realistic property determination.
Core-log correlation is a powerful process that allows petrophysicists and petroleum engineers to more accurately characterize an entire field for a much lower cost than would be needed to core each and every well.
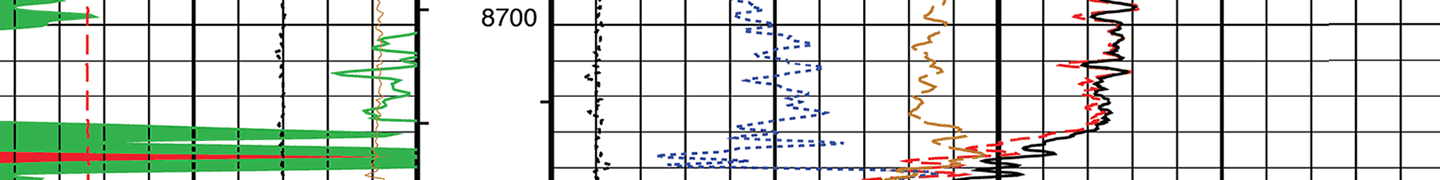
Now that you’ve seen how it’s done, let’s put a bunch of these technologies together on one chart and explore a real log. Mouse-over anything highlighted to get more details. A well log is rich with embedded information and can be overwhelming to the uninitiated. We are providing a full-sized, realistic well log, covering nearly 9,000 feet of information. Consequently, this is a long document. Take your time scrolling through it. It has nuggets of information distributed from top to bottom. You might need to frequently return to the headers (top of the log) to refresh your memory as to which curve represents what log.

Images: “Core Log Render” by Top Energy Training