Header
At the top of the log is the header. This supplies any pertinent information about the well log, such as the location of the well and the acquisition and processing perimeters. Here we are showing a log that was provided by an exploration and drilling company, so we have blacked out proprietary information.+
Downhole Equipment
This explains the tool configuration. This section lists the tools used in logging and their location along the length of the tool (in feet) by the numbers to the right of the tool. Each abbreviation represents a different tool. For example the HGNS is the highly integrated gamma ray neutron sonde, a device that measures the neutron porosity of the rocks. Abbreviations and acronyms vary by company.+
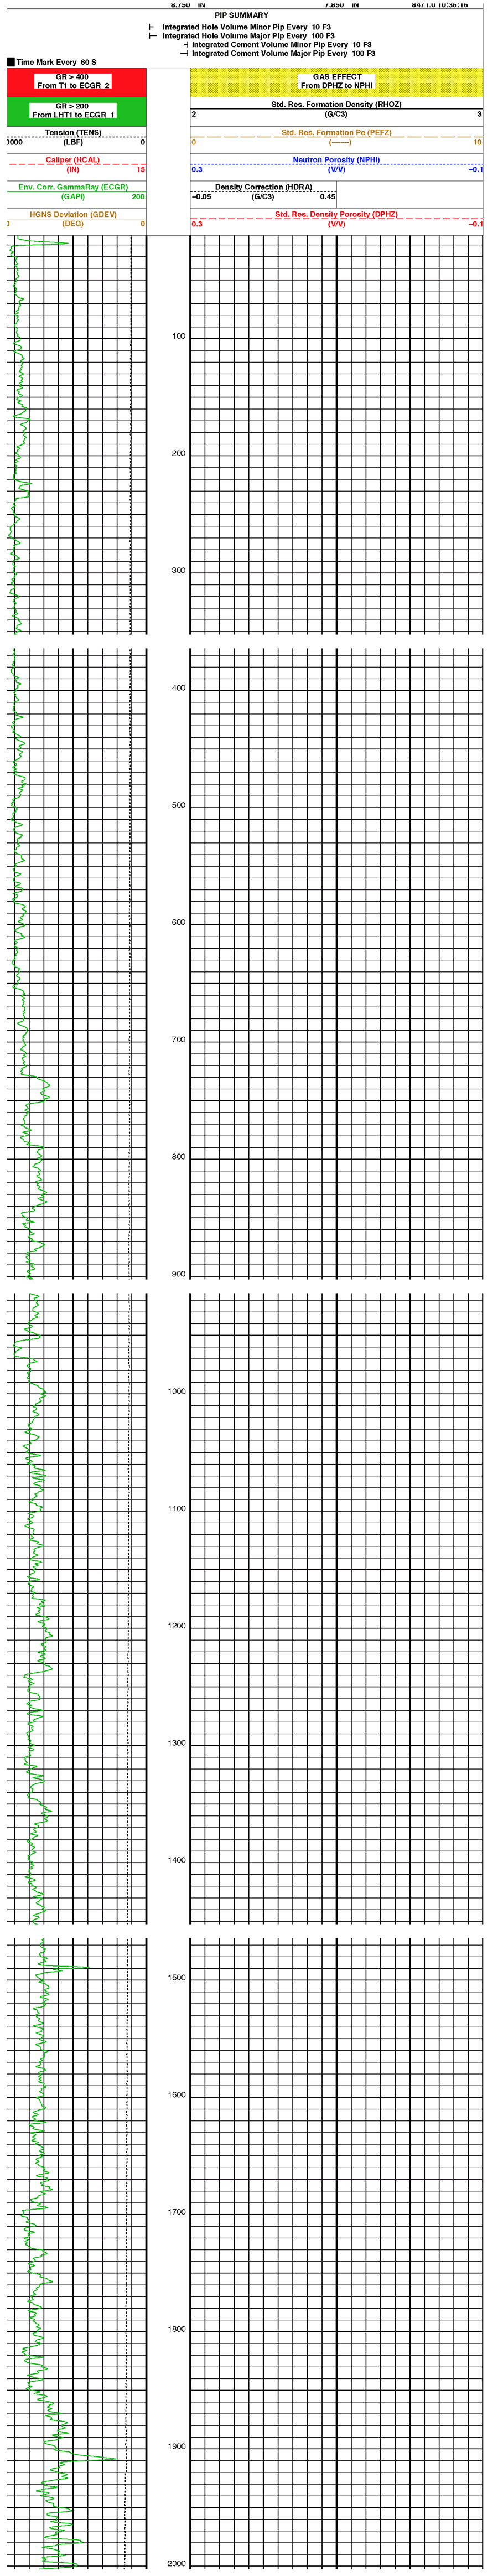
Track 1
This is the upper scale to Track 1. Track 1 is always the left panel and includes naturally occurring gamma ray, tension, and neutron porosity.+
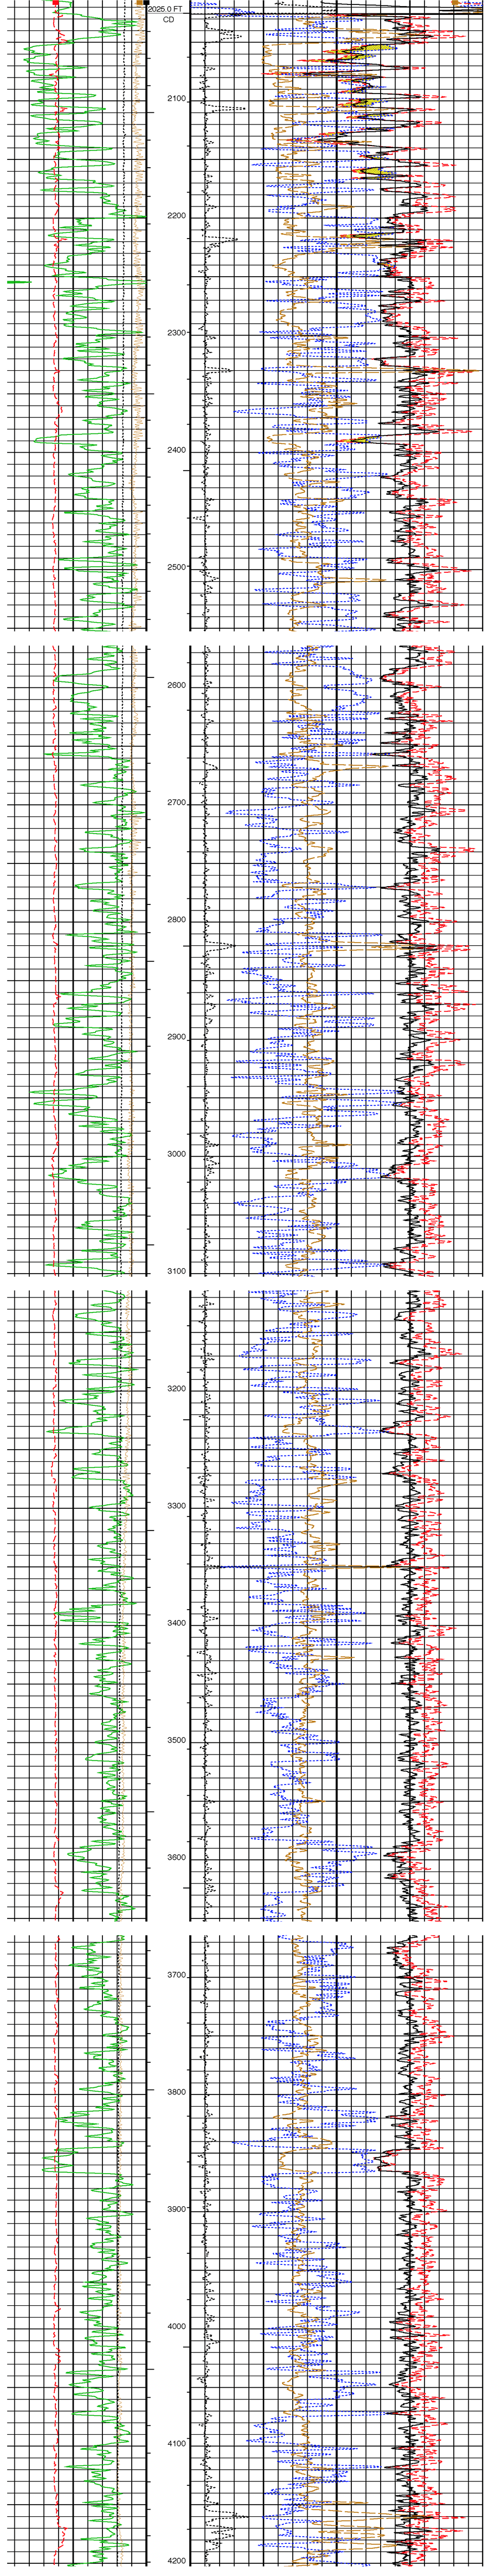
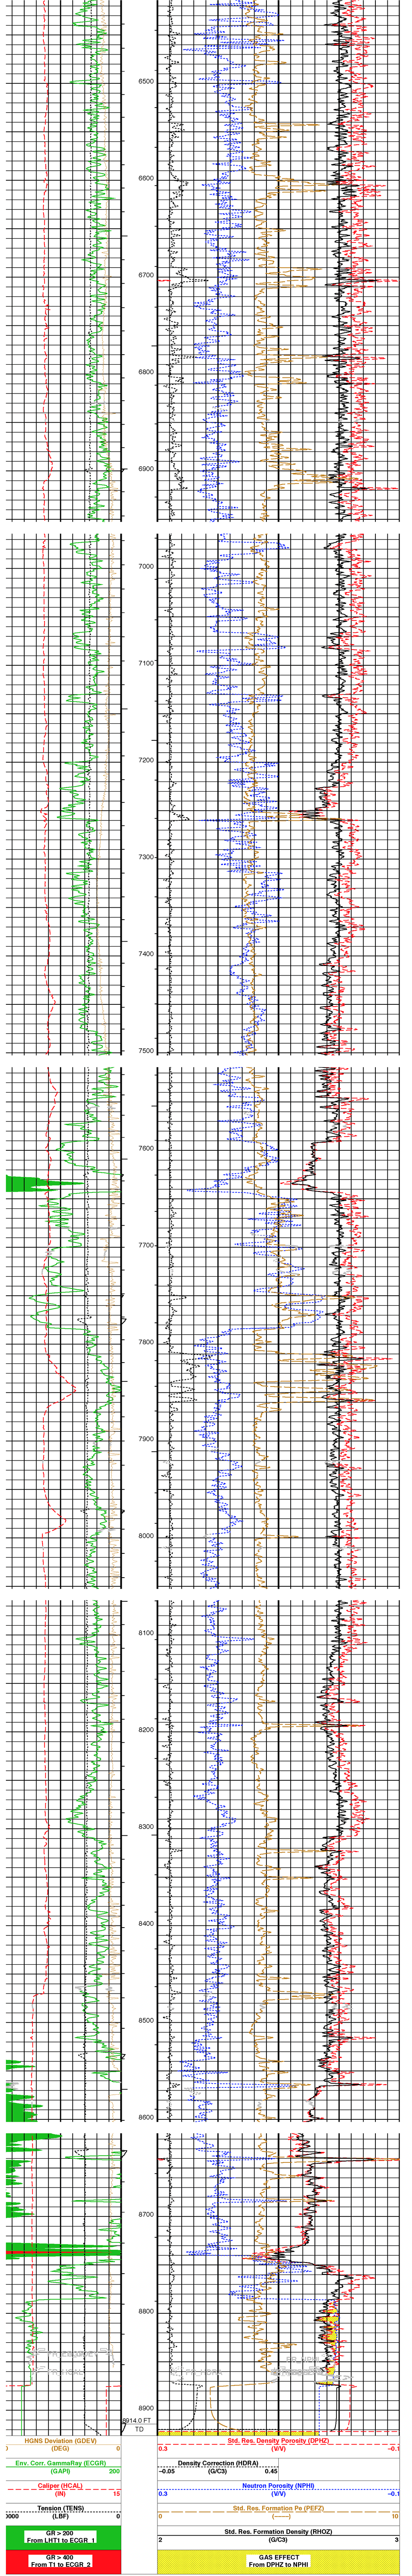
Track 2
Track 2 is on the right and includes the gas effect, standard resolution formation density, Standard resolution formation photoelectric factor, neutron density, density correlation, and standard resolution density porosity.+
Gamma Ray
Note that gamma ray has three different color representations, a green line, a solid green area and a solid red area. If the gamma ray reading is between 0-200, we will only see a green line. If it is between 200-400 we will see the green line wrap around and include a solid green area. If it is greater than 400, the green line and solid green area will wrap around the curve twice and display a solid red.+
+
+
+
+
+
+