
There was once a time when mud logging was the only source of information about the rock units encountered during well drilling. Although mud logging still provides important information, especially while drilling is in progress, the advent of well logging early in the 20th century opened up a whole new world when it came to quantifying downhole formations.
We’ve covered the basic principles for interpreting each well log individually. But the real power of well logging as a formation evaluation tool becomes apparent when we combine various logs to come to conclusions about the production capabilities of the well. One standalone log might indicate positive or negative potential, but when multiple logs are interpreted together, they can provide a much bigger and better overall view of the well and reservoir potential. Keep in mind that no logging tool directly measures the value that it is intended to determine, but rather provides a physical measurement that must be interpreted (i.e. a density tool measures density that is then interpreted to be a given porosity). Therefore, it stands to reason that the overall picture provided by all the logs must also be interpreted.
Methods for Well Log Interpretation
Three primary methods are used for well log interpretation today:
Manual Interpretation
Manual interpretation was the only method of well log interpretation for much of the field’s history. This interpretation method relies on quantitative assessment of the logs by a knowledgeable, well-trained specialist.
Usually, interpretation starts with the mud log. By analyzing cuttings brought up from depth, in combination with information on the drilling rate and gas content, operators can come up with a preliminary assessment of the characteristics of the strata intersected by the wellbore. and the potential presence of oil and/or natural gas.
Once the well logging results are in, a more detailed interpretation is often carried out one unit at a time. The operator will examine the well log results to see if any of the logs in the depth range of the unit under consideration are diagnostic of the units inferred from the mud log. If the mud log and one of the logging tools seems to suggest a certain type of lithology, the operator will look at the rest of the logs and change their hypothesis if there is contradictory data.
One important part of manual well log interpretation is the comparison of logging results from a certain section of a well with the accurate measurements made on a core sample from that section. This quick, qualitative core-log correlation can be supplemented by the statistical methods discussed in the video on the next page.
Semi-quantitative interpretation
In semi-quantitative interpretation, a computer is used to display graphical aids, which help in interpretation. For example, a log may be displayed on a different scale, or a single attribute of a complex log may be singled out. Alternatively, data from multiple logs can be combined using statistical analysis. A combination of several logs is often required in interpretation and computers make the process easier.
Computerized quantitative interpretation
In computerized quantitative interpretation, a computer is allowed to make all the decisions about log interpretation. The data from each log is fed into the computer, which then performs a complex statistical analysis to determine significant groupings in the data, which might indicate formations with certain attributes or a typical rock type that repeats more than once in a sequence. The computer will also take advantage of any core data, as well as data collected by other wells in the same region.
Of course, a computer is only as capable as its operator, and the results of computerized analysis will still need to be reviewed by a human expert.
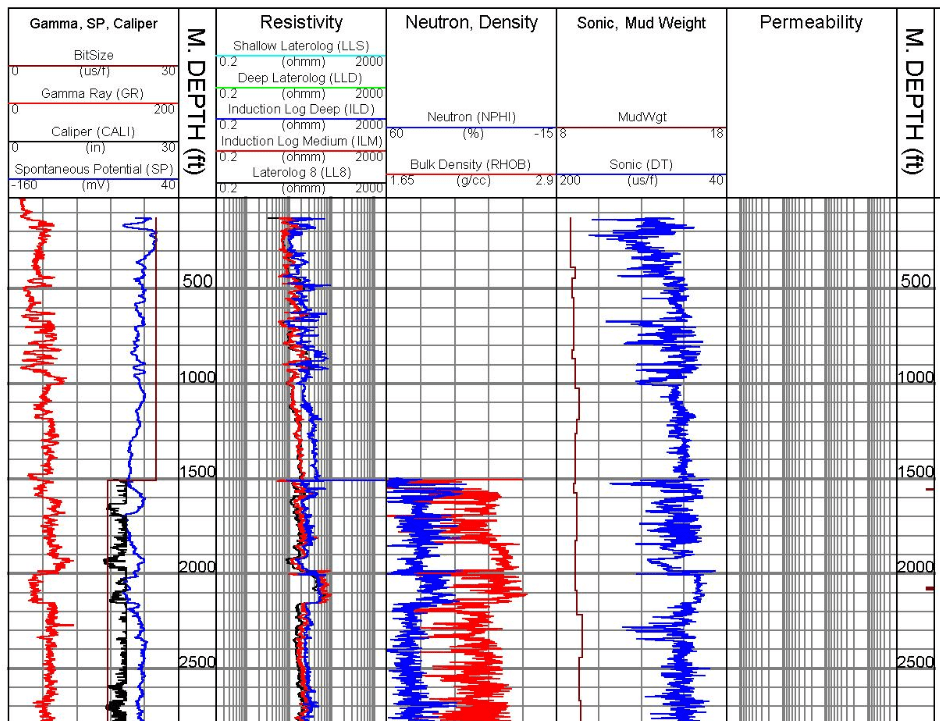
The following well log suite demonstrates how different logs are placed side-by-side for interpretation. When logs are placed side-by-side like this, they are referred to as “tracks”. In this example, the gamma ray and spontaneous potential logs are in Track 1, the depth is Tracks 2 and 7, the shallow/medium/deep resistivity curves are in Track 3, the neutron porosity and bulk density are shown in Track 4, and the sonic curve in Track 5. Mud weight as determined by the drilling crew is also plotted in Track 5. Space for any sampled permeability measurements is reserved in Track 6.
Images: “Well Log Interpretation” by Top Energy Training; “well log” by LI1LOG via Wikimedia Commons