
Oil spills impact public health, drinking water and natural resources and can create significant safety hazards.1EPA, 2010, Spill Prevention, Control and Countermeasures (SPCC) 40C FR Part112, A Facility Owners Guide to Oil Pollution Prevention, EPA 540-K-09-01, accessed March 27, 2023, https://www.epa.gov/oil-spills-prevention-and-preparedness-regulations/facility-owneroperators-guide-oil-pollution. It is therefore imperative to not only prevent spills but to also report, track and analyze spill data to identify causes, and to improve prevention programs and regulatory processes.
Reporting and tracking oil spills within the energy sector is complex due to the various components that make up this sector (e.g., upstream, midstream, refining, transportation), and the resulting hierarchy and interactions of federal, state and local regulations. In addition to oil spill reporting, state agencies may have more extensive reporting for spills and releases of exploration and production waste.
To provide meaningful and actionable data, state, local, tribal, and provincial regulatory agencies should focus on the component of the energy sector within their primary jurisdiction for review and analysis. For example, in late 2013 the Colorado Oil & Gas Conservation Commission (COGCC) conducted an extensive review of spill reporting data of upstream exploration and production operations within Colorado. The Colorado state legislature, local governments and citizen activist groups were concerned about an increase in oil and gas drilling and hydraulic fracturing and believed that these operational phases accounted for a significant number of spills. The legislature also directed the COGCC to conduct inspections following a risk-based strategy and to focus on the operational phase that was most likely to experience spills and releases. The first step in building the risk-based strategy was to review and analyze spill report data.
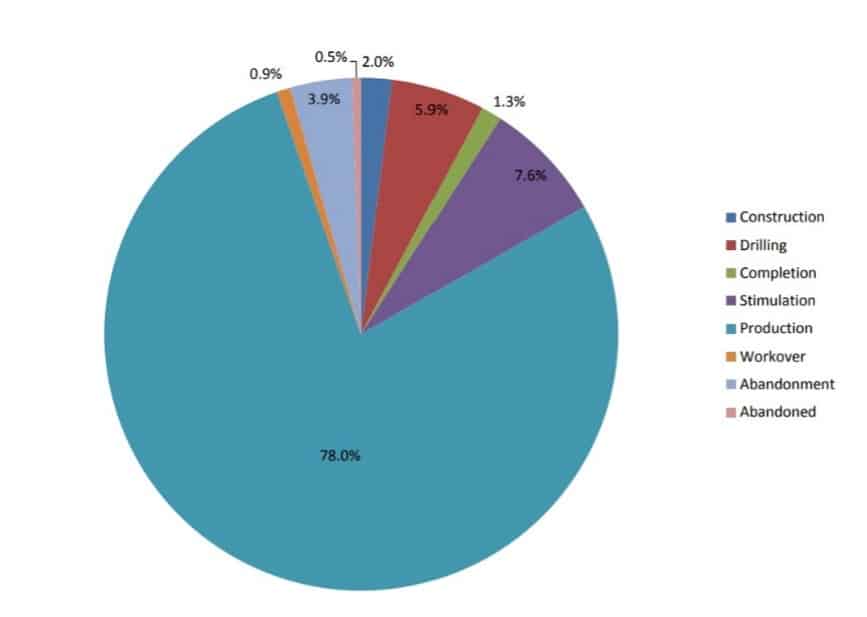
This spill analysis project focused on identifying the operational phase with the most spills, the cause of spills and the location of spills or releases. A total of 1,638 reports covering a three-year period (2010-2013) were reviewed.2S.S. Papadopulos & Associates, Inc, November 18, 2013, Technical Memorandum, Spill/Release Report, accessed March 27, 2023, https://cogcc.state.co.us/documents/library/Technical. The phase with the most reported spills was the operational phase (78%), which included production and workovers (see pie chart below).
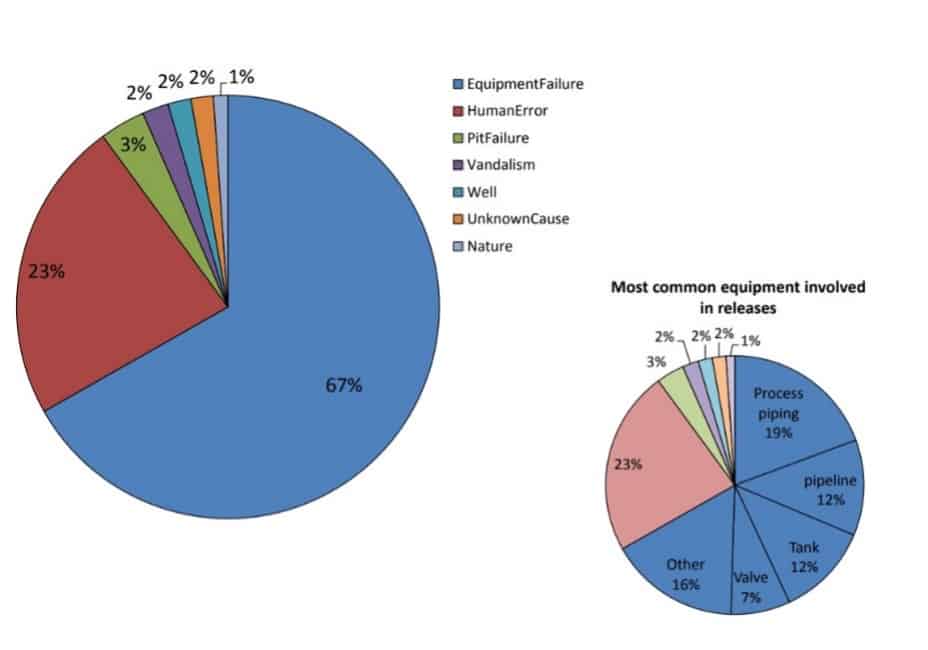
The primary cause of spills was identified as equipment failure (67%) with human error the second highest reported cause at 23% (see pie chart below).
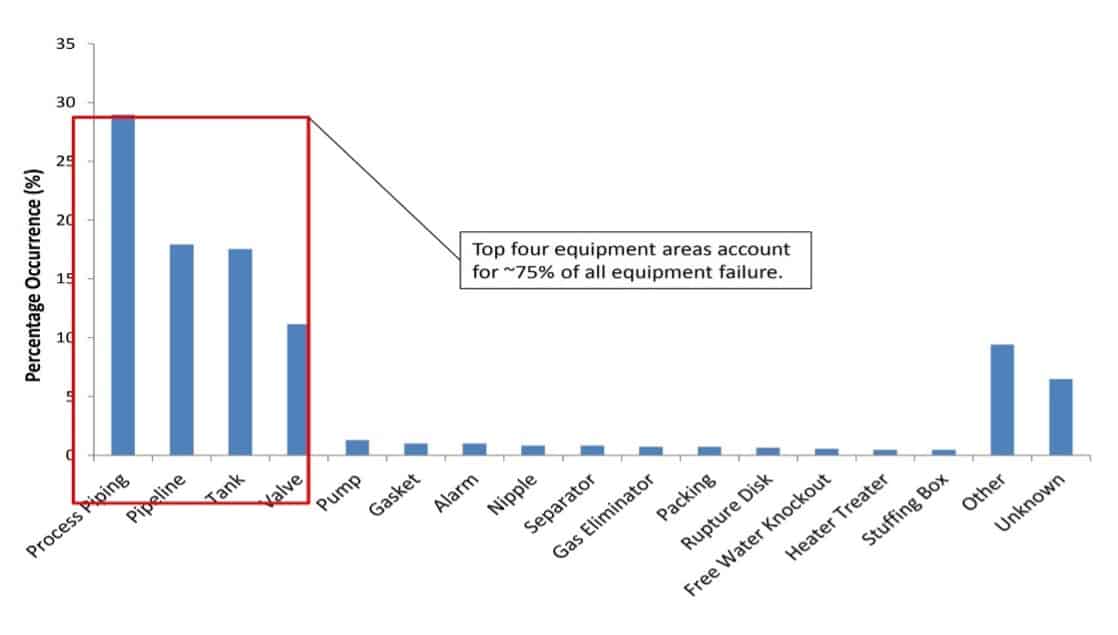
The review highlighted that four components (process piping, pipelines, tanks, and valves) accounted for nearly 75% of all equipment failures (see bar chart below).
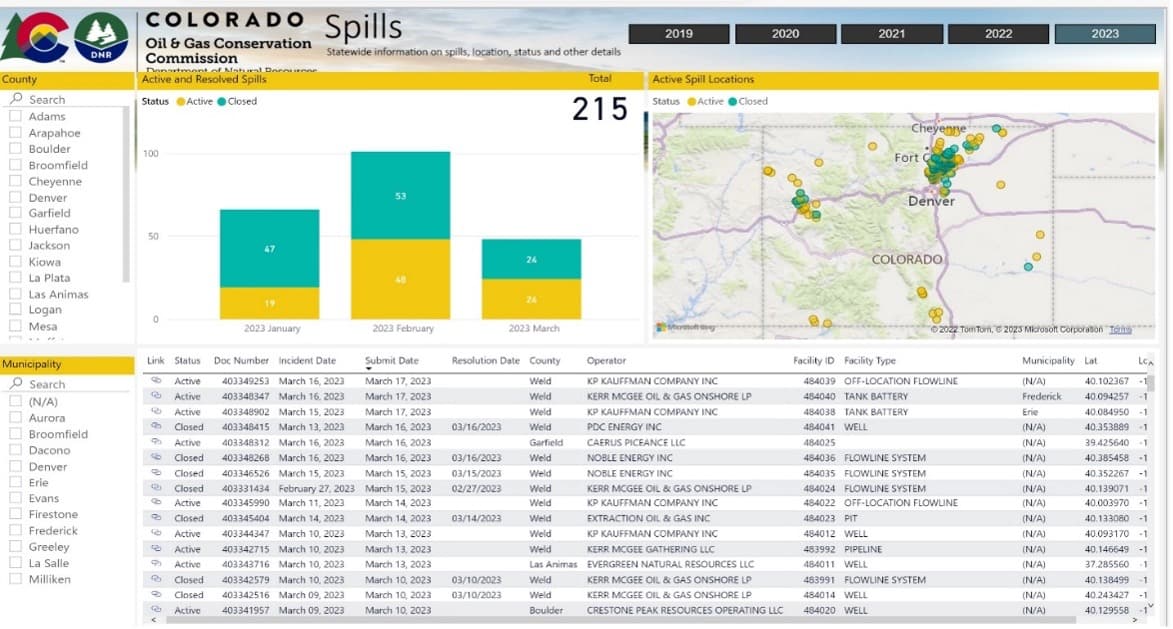
As a result of this analysis the COGCC developed an improved spill reporting form and process, and improved reporting guidance for the Colorado oil and gas operators. The improved spill reporting allowed for the development of an online spill tracking database easily accessible by operators, outside governmental bodies and private citizens.
Additionally, the COGCC organized an integrity team within the engineering department that conducted audits and site inspections and the field inspection unit integrated the spill report data into a risk-based strategy for well inspections.
Images: “Deepwater Horizon Oil Spill – Gulf of Mexico” by Kris Krug licensed under CC BY NC SA 2.0