Once CO2 has been sequestered in the subsurface, scientists and regulators need to ensure it remains safely and permanently stored in the target AoR and that all USDWs are protected. While the evidence attained from EOR, research, and current commercial-scale CCUS efforts strongly suggests that CO2 storage is safe and sustainable, sites still need to be well-selected, well-designed and operated appropriately. This requires that the risks associated with these large-scale projects be identified and quantified. Storage risks related to CO2 migration and physical/chemical effects on the subsurface need to be pinpointed and closely monitored throughout any project’s lifecycle.
Monitoring, verification and accounting (MVA) is an important part of every carbon capture and storage project, occurring before, during and after the injection phase. The MVA plan for a project can have a broad scope, encompassing: CO2 storage conformance and containment, monitoring techniques for internal quality control, and verification and accounting for regulators regarding monetizing benefits of geologic storage. Additionally, monitoring allows operators to locate the injected CO2 plume, reevaluate AoR and ensure that potable water sources and ecosystems are protected throughout the lifecycle.
How and where does monitoring occur? Below is a diagrammatic overview of monitoring during carbon sequestration operations to ensure CO2 does not leak or migrate from the AoR. Tools are typically categorized as atmospheric, near-surface or subsurface.
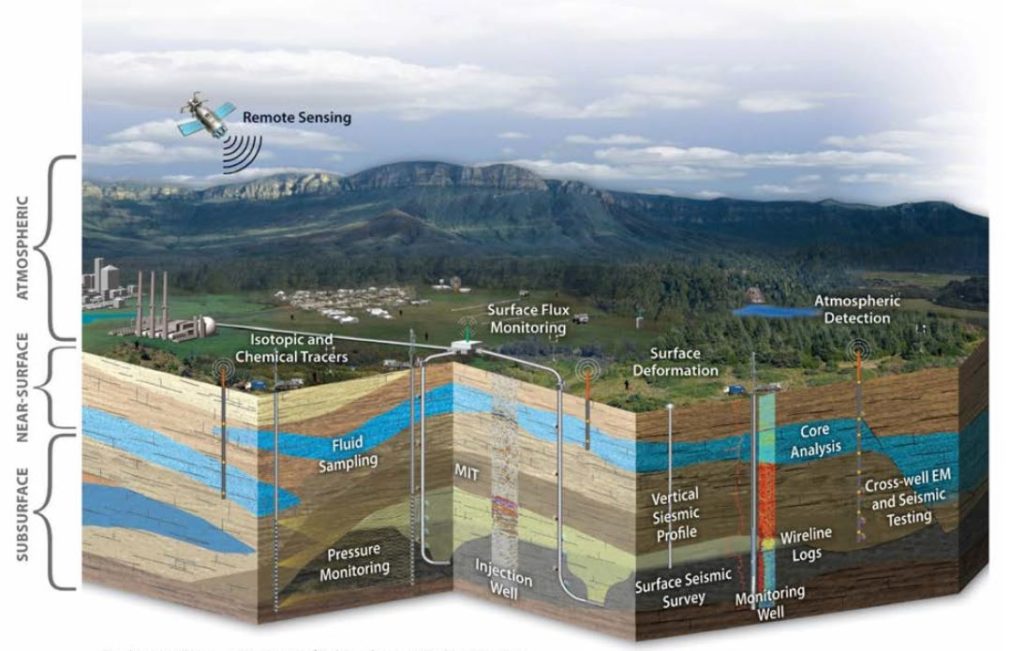
Atmospheric Monitoring Tools
Atmospheric monitoring involves testing at the surface and in the atmosphere to identify and quantify possible releases associated with carbon sequestration operations. A reliable, above-ground monitoring system can detect elevated levels of atmospheric CO2 that may have been released from wellbores, faults or other conduits.1USDOE. (2017). Best practices: Monitoring, verification, and accounting (MVA) for geologic storage projects (revised edition). DOE/NETL-2018/1847.
Under subpart RR of the Greenhouse Gas Reporting Program, facilities carrying out geologic sequestration operations must report basic information on the amount of CO2 received for injection; develop and implement an EPA-approved monitoring, reporting and verification (MRV) plan; and report the amount of CO2 stored and annual monitoring activities. The MRV plan must specify a strategy for detecting and quantifying surface release of CO2 and an approach for establishing baselines for monitoring CO2 surface releases.2USDOE. (2017). Best practices: Monitoring, verification, and accounting (MVA) for geologic storage projects (revised edition). DOE/NETL-2018/1847.
The MRV plan identifies the active monitoring area (AMA) and the maximum monitoring area (MMA). The MMA represents the expected maximum area to be monitored for CO2 throughout the life of the project.
The AMA is monitored from the first year of the period (n) to the last year in the period (t). The boundary of the AMA is established by superimposing two areas: (1) The area projected to contain the free phase CO2 plume at the end of year t, plus an all-around buffer zone of one-half mile or greater if known release pathways extend laterally more than one-half mile; and (2) The area projected to contain the free phase CO2 plume at the end of year t+5.
The MMA means the area that must be monitored under this regulation and is defined as equal to or greater than the area expected to contain the free phase CO2 plume until the CO2 plume has stabilized plus an all-around buffer zone of at least one-half mile.
40 CFR § 98.449
Atmospheric monitoring tools may be part of the MVA plan in order to provide additional evidence that migration to the atmosphere is not occurring. Example atmospheric monitoring tools include optical CO2 sensors and atmospheric tracers. You may wish to examine a table of atmospheric monitoring techniques with descriptions, benefits and challenges revised in 2017 by the National Energy Technology Laboratory of DOE.3USDOE. (2017). Best practices: Monitoring, verification, and accounting (MVA) for geologic storage projects (revised edition). DOE/NETL-2018/1847.
Near-surface Monitoring Tools
Near-surface monitoring involves testing in the vadose zone (above the water table) and groundwater sources to identify and quantify possible releases associated with carbon storage operations. Geochemical tools can identify and quantify possible migration of CO2 from the subsurface into the vadose zone and shallow groundwater sources. Surface displacement monitoring and ecosystem stress monitoring are also options to consider.4USDOE. (2017). Best practices: Monitoring, verification, and accounting (MVA) for geologic storage projects (revised edition). DOE/NETL-2018/1847.
The owner or operator of a Class VI well must prepare, maintain, and comply with a testing and monitoring plan to verify that the geologic storage project is operating as permitted and is not endangering USDWs.
40 CFR § 146.90
[Testing and monitoring associated with GS projects must, at a minimum, include:] Periodic monitoring of the groundwater quality and geochemical changes above the confining zone(s) that may be a result of CO2 movement through the confining zone(s)
40 CFR § 146.90(d)
EPA specifies that monitoring frequency and spatial distribution will be decided using baseline geochemical data for near-surface formations, including all the USDWs in the AoR. Specific information about the geologic storage project, including injection rate and volume, geology, the presence of artificial penetrations, AoR and other factors, determines the location and number of USDW monitoring wells to be used. Soil-gas monitoring to detect movement of CO2 may be required at the discretion of the EPA administrator.5USDOE. (2017). Best practices: Monitoring, verification, and accounting (MVA) for geologic storage projects (revised edition). DOE/NETL-2018/1847.
The methodology and instrumentation used to quantify near-surface emissions are not specified in the regulations. Surface displacement monitoring and ecosystem stress monitoring are not required in regulation, although they might lie within the scope of technologies that may be considered, depending upon the project.6USDOE. (2017). Best practices: Monitoring, verification, and accounting (MVA) for geologic storage projects (revised edition). DOE/NETL-2018/1847.
Examples of near-surface monitoring include soil gas sampling, groundwater sampling and surface displacement monitoring. You may wish to examine a table of near-surface monitoring techniques with descriptions, benefits and challenges revised in 2017 by the National Energy Technology Laboratory of DOE.7USDOE. (2017). Best practices: Monitoring, verification, and accounting (MVA) for geologic storage projects (revised edition). DOE/NETL-2018/1847.
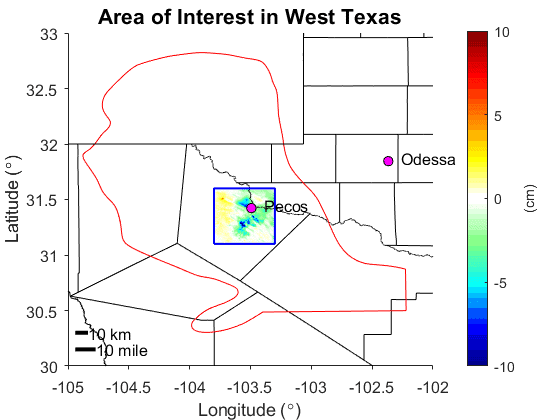
Near-surface Monitoring Technique: InSAR in the Permian Basin
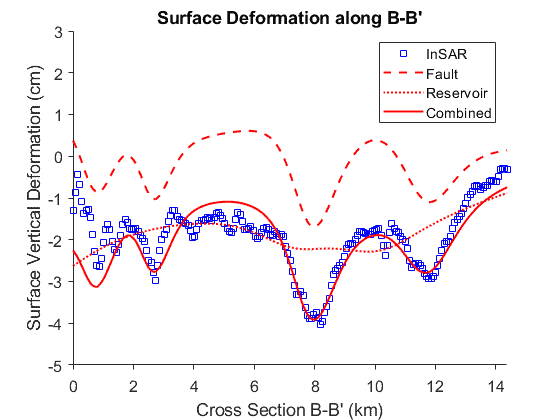
Interferometric synthetic aperture radar (InSAR) data can be used to monitor surface deformation through time at the cm scale. When InSAR is combined with elastic inversion modeling, the magnitude and location of reservoir pressure changes and fault movement associated with CO2 injection can be characterized.
Research in the Permian Basin demonstrates the ability of InSAR to map how the basin’s surface deforms in response to fluid injection and extraction. Scientists observed numerous subsidence and uplift features near active production and disposal/injection wells. The observed deformation rate was the highest in 2018 when the largest volume of oil and gas was produced in the basin. The maps below show the study area with both observed (InSAR) and modeled deformation indicated in cm of vertical movement, with warm colors indicating uplift and cool colors indicating subsidence.8Staniewicz, S., Chen, J., Lee, H., Olson, J., Savvaidis, A., Reedy, R., … & Hennings, P. (2020). InSAR reveals complex surface deformation patterns over an 80,000 square kilometer oil‐producing region in the Permian Basin. Geophysical Research Letters, e2020GL090151.
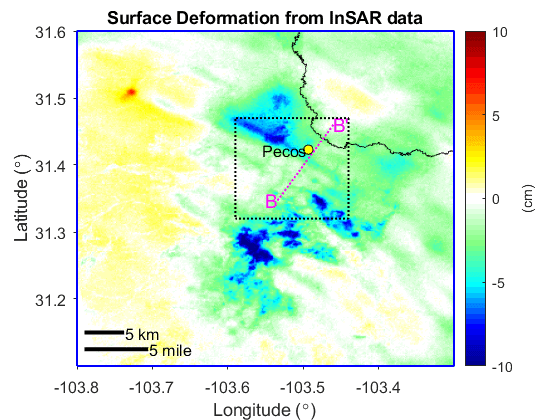
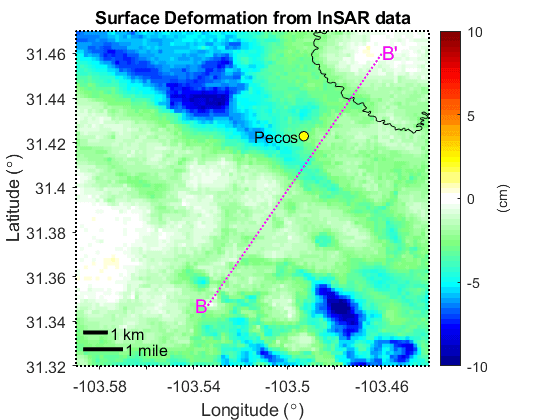
The study achieved ∼2 mm/year accuracy of modeling results compared to InSAR data across the basin. Two mechanisms of deformation were modeled: (1) fault movement and (2) reservoir pressure change due to depletion or injection. Elastic modeling results demonstrate that fluid extraction and movement along normal faults are potential causes for the seismicity cataloged by the Texas Seismological Network and deformation patterns observed from InSAR data. The implication for the scientific community is that the increase in high‐quality satellite‐based data now allows monitoring of vast areas for subsurface stress and pore pressure changes in oil‐producing regions and carbon storage projects.9Staniewicz, S., Chen, J., Lee, H., Olson, J., Savvaidis, A., Reedy, R., … & Hennings, P. (2020). InSAR reveals complex surface deformation patterns over an 80,000 square kilometer oil‐producing region in the Permian Basin. Geophysical Research Letters, e2020GL090151.
Subsurface Monitoring Tools
Subsurface monitoring involves testing to locate CO2 in the target and surrounding storage formations. Objectives include monitoring the evolution of the dense-phase CO2 plume, assessing the area of elevated pressure caused by injection, and determining that both pressure and CO2 are within the expected and acceptable areas and migrating in a way that does not damage resources or the integrity of the storage complex. Tracking the movement of an injected CO2 plume in a deep geologic formation can include defining the lateral extent and boundaries of the plume as expected by EPA under Class VI rules to show that the plume remains in the AoR.
In addition, measurements of the area and saturation of CO2 over time can be used to validate numerical models, which may increase their reliability in terms of predicting the long-term stability of the CO2 plume. Additional measurements may also be planned to track plume stabilization during the post-injection period. EPA also requires measurement of pressure changes in the reservoir as part of a Class VI permit.
Most techniques and tools used for subsurface monitoring were originally developed to characterize the geologic framework and rock and fluid properties of hydrocarbon producing reservoirs. These same tools can play a similar role in a CO2 storage setting. Examples of subsurface monitoring techniques include wireline tools, wellbore pressure and temperature gauges, wellbore-based fluid sampling, seismic geophysical methods and tomography. You may wish to examine a table of subsurface monitoring techniques with descriptions, benefits and challenges revised in 2017 by the National Energy Technology Laboratory of DOE.10USDOE. (2017). Best practices: Monitoring, verification, and accounting (MVA) for geologic storage projects (revised edition). DOE/NETL-2018/1847.
Images: “Cranfield subsurface monitoring” by Hilary Olson